A case study on the Aspen Movie Map

By: Roshan Karki

The “Aspen Movie map” was the first interactive movie map produced at MIT’s Architecture Machine Group, Nicholas Negroponte’s proto Media lab as MIT pre-Media Lab project in the late 1970s of Aspen, Colorado. It was the first interactive “virtual travel” project which was an academic, non-commercial and classified. The principal Investigator of this project was Andrew Lippman who was already a long-time colleague of Nicholas. This project was funded by DARPA’s Cybernetics Technology Office headed at the time by Craig Fields who had already supported other projects relating to visual mapping. “The goal of preparing Aspen Movie Map was to create so immersive and realistic a “first visit” that newcomers would literally feel at home, or that they had been there before” recalls Andrew. It means the goal was to create visual seamlessness as one drives around.

While preparing this interactive map a gyroscopic stabilizer with 16mm stop-frame cameras was mounted in top of a camera car and a fifth wheel with an encoder triggered the cameras every 10 feet. The camera car was drove up and down the streets of Aspen, Colorado shooting with the film cameras on the top of the car triggered by distances rather than time. For Example, one frame is equals to 10 feet. Filming took place daily between 10 AM and 2 PM to minimize lighting discrepancies. The camera car carefully drove down the center of the street for registered match-cuts. In addition to the basic “travel” footage, panoramic camera experiments, thousands of still frames, audio, and data were collected. The playback system required several laserdisc players, a computer, and a touch screen display. Very wide-angle lenses were used for filming, and some attempts at orthoscopic playback were made. The film was assembled into a collection of discontinuous scenes (one segment per view per city block) and then transferred to laserdisc, the analog-video precursor to modern digital optical disc storage technologies such as DVDs. A database was made that correlated the layout of the video on the disc with the two-dimensional street plan. Thus linked, the user was able to choose an arbitrary path through the city; the only restrictions being the necessity to stay in the center of the street; move ten feet between steps; and view the street from one of the four orthogonal views. Commands were sent from the client process handling the user input and overlay graphics to a server that accessed the database and controlled the laserdisc players.

The Aspen Movie Map was prepared for military application to solve the problem of quickly familiarizing soldiers with new territory. The Department of Defense had been deeply impressed by the success of Operation Entebbe in 1976, where the Israeli commandos had quickly built a crude replica of the airport and practiced in it before attacking the real thing. DOD hoped that the Movie Map would show the way to a future where computers could instantly create a three-dimensional simulation of a hostile environment at much lower cost and in less time.


References:

v  Lippman, Andrew, “Movie-maps: An application of the optical videodisc to computer graphics,” Proceedings of the 7th annual conference on Computer graphics and interactive techniques, Seattle, Washington, United States, 1980, pp. 32–42.

v  Mohl, Robert, Cognitive space in the interactive movie map: an investigation of spatial learning in virtual environments, Thesis Arch 1982 Ph.D., Massachusetts Institute of Technology.

v  Naimark, Michael, “Aspen the Verb: Musings on Heritage and Virtuality,” Presence: Teleoperators and Virtual Environments, Special Issue on Virtual Heritage, MIT Press Journals, Vol. 15, No. 3, June 2006.

v  Michael Naimark “Place Runs Deep: Virtuality, Place and Indigenousness“,Virtual Museums Symposium, ARCH Foundation, Salzburg, AUSTRIA, 1998

Russian Missions

                     Russian Space Missions

Russian Space mission was conducted by the former Union of Soviet Socialist Republics (U.S.S.R.) from the 1930s until its dissolution in 1991.With the fall of the Soviet Union Russia and Ukraine becomes its immediate heirs. Russia created the Russian Aviation and Space Agency, now known as the Russian Federal Space Agency (Roscosmos) or RSA. Ukraine created the National Space Agency of Ukraine (NSAU).

Initial Development

Initially space program was boosted by the assistance of captured scientists from the advanced German rocket program. Space programs were performed mainly by Soviet engineers and scientists after 1955, and were based on some unique Soviet and Imperial Russian theoretical developments.Konstantin Tsiolkovsky (17th Sept 1857 – 19th Sept 1935) also known as “father of theoretical astronautics” has great contribution to make the satellite launching possible. Konstantin derived “Formula of aviation” which shows the relationship between:

  • speed of a rocket at any moment
  • specific impulse fuel
  • mass of the rocket in the initial and final time

Image

Sergei Korolev (12th January 1907- 14th January 1966) was the head of the principal design group. He was Soviet rocket engineer and spacecraft designer in the Space Race between the United States and the Soviet Union. He is also known as “Father of practical astronautics”.

First Satellite Construction

On 17 December 1954, Sergei Korolev addressed Minister of Defence , proposing the development of an artificial satellite .On 29 July 1955 the U.S announced, that the U.S would launch an artificial satellite by 1970.That press statement troubled Russia. On 30 January 1956 the Council of Ministers approved practical work on an artificial Earth-orbiting satellite. This satellite, named “Object D”, was planned to be completed in 1957–58.That satellite construction got problems in assembly and low impulse caused delay. Fearing US would launch satellite before USSR a new simple, light and easy to construct with a simple radio transmitter proposed named R-7.The first launch of an R-7 rocket (8K71) occurred on 15 May 1957. The flight was controlled until the 98th second, but a fire in a strap-on rocket led to an unintended crash 400 km from the site Three attempts to launch the second rocket (8K71 No.6) were made on 10–11 June, which failed because of a mistake made during the rocket’s assembly. The unsuccessful launch of the third R-7 rocket (8K71 No.7) took place on 12 July. During the flight the rocket began to rotate about its longitudinal axis and its engines were automatically turned off. The launch of the fourth rocket (8K71 No.8), on 21 August was successful. Its head part separated, reached the defined region, entered the atmosphere, and was destroyed at a height of 10 km because of thermodynamic overload after traveling 6,000 km. On 22 September a modified R-7 rocket, named Sputnik and indexed as 8K71PS, arrived at the proving ground and preparations for the launch of PS-1 began. Sputnik was the first artificial earth satellite having 58 cm (23 in) diameter polished metal sphere, with four external radio antennas to broadcast radio pulses. It was launched into an elliptical low Earth orbit on 4 October 1957.It travelled at about 29,000 kilometers per hour taking 96.2 minutes to complete each orbit. The signals were transmitted on 20.005 and 40.002 MHz which were monitored by amateur radio operators throughout the world. Those signals continued for 22 days until the transmitter batteries ran out on 26 October 1957.The first satellite was burned up on 4 January 1958, as it fell from orbit upon reentering Earth’s atmosphere, after travelling about 70 million km and spending 3 months in orbit. Yuri Gagarin was the first man to fly in space.Valentina Tereshkova was the first women to travel to space for about 70.8 hour flight on Vostok 6 which made 48 orbits of Earth.

First unmanned Moon landing occur in 1959 with the Luna 2 spacecraft and Luna 3 collects first photos of lunar far side.Baikonur Cosmodrome in Kazakhstan and Plesetsk Cosmodrome in northern Russia are the launching site of satellites.


Foreign employment and its impacts on the economy of Nepal

By: Roshan Karki

Introduction

Migration of people from one place to another is a usual phenomenon since the beginning of human civilization. The migration in the beginning was for the sake of food and exploring new places for security purpose. But gradually the migration took the shape in diverse form and now has become a very essential and common in each and every corner of the world. Today, most of the people migrate in search of better employment opportunity. Especially in the developing countries like Nepal, most people migrate to foreign land in search of employment so that they can well feed and support their families. Nepal has a long history of migration of people for employment. For around 200 years, Nepali men (and to a lesser extent women) have been leaving their homes to seek employment and living abroad. Even before the well-known recruitment to British-Indian armies, poor Nepalese fled excessive taxation, corves labor and exploitation from state agencies. In this context, on the backdrop of the current political transition of Nepal and the instability that comes with it (especially in the economic sector), Nepal’s economy has largely rested on its population opting for foreign employment. With subsistence agriculture as a major economic activity, staggering number of unemployed, low investments in the industrial sector owing to power cuts as high as sixteen hours a day and disturbed political and business environment, the number of people leaving for foreign employment has been ever rising each and every day. The reasons behind the migration are almost same in Nepal as other parts of the world. Existing poverty, limited employment opportunities, deteriorating agricultural productivity, armed conflict are some of the reasons about the motives behind migration of people for foreign employment. There are many villages in Nepal where the labor migration has been established as a culture of community to go aboard for work for a while and return back with some money and experience of placement in different geographical location. The influence of friends, relatives and well wishers has also played a prominent role to the promotion of international labor migration. According to the Department of Foreign Employment, the number of Nepalese leaving the country for overseas jobs increased by 52.15 percent, to 45,165 from mid-July to mid-August compared to the figure of the same period of 2010. A total 29,685 Nepalese had gone abroad for jobs during that period of 2010.


Plans for Nepal’s development have tended to pay relatively little attention to foreign labor migration and flows of remittances back home; despite evidence of their substantial importance to rural households. Even the remittance that country receives each year is not used in productive work. Most of the amounts are being spent on household expenditure, health services, education for the children and constructing new houses, other essential reconstruction work and pay back lone taken by the migrant workers. It is seen that neither our government nor the migrants have appropriate vision to invest their earning in the productive work. Such negligence from government of Nepal in term of foreign employment are dropping country away from development as people are involving in the development of other countries rather than their own countries.


Impacts of the foreign employment and economy of Nepal

Foreign employment has huge influence in the economy of our country Nepal especially these days as development works have been disturbed due to the political instability and disturbed business environment.


Positive impacts

In the last 10-15 years, the Nepalese government has recognized the significance of labor migration and remittances to the national economy because these represent a huge source of foreign exchange and income in the form of tax. Only in the last couple of years has new research generated information and data to reveal the extent of Nepal’s dependency on foreign labor employment and remittances. It has held the poorest household as the remittances has prevented the loss of existing assets of the people. It has also helped in improving the supplies of food, education and access to medical treatment and helped in the improvement of living standards of normal people. Remittances have been used to purchase lands in the urban areas, to start small business and to provide quality education to the family members, which have uplifted the standard living of the people.Returnees are the trained and skilled manpower and able to contribute to the country.More aware and disciplined human resources are now available in the service of society.Re-ploughing of earnings of the migrant workers would help generate the employment opportunities for other unemployed people in the country.

Negative impacts

Foreign labor migration is not without its negative impacts, though. Migrants workers have faced problems both in the home country and the country of destination, where as the problems in abroad are highlighted very much as compared to the problem that they are being in the national level. Most of the Nepalese migrant workers going abroad through illegal channels have very low living standards and inhumane working environments. Due to the limitation of information sources, the rate of frauds and cheating among workers going through illegal channels is much higher compared to workers going through formal channels. Men are not only involved in foreign employment. There is huge participation from women also which led to the problem of women trafficking. Also, among women  migrant workers physical and sexual abuses by employers is common and abandoned babies caused by unwanted pregnancies is among the major issues Nepalese embassies at gulf countries are having to deal with. The trafficking of women, the migration of child laborers across international borders (especially to India), national labor shortages and the flow of immigrants into Nepal (especially from India) are phenomena that also occur alongside foreign labor migration. Policies related to foreign labor migration must seek to address this range of issues.

Though there are both positive and negative impacts, major impacts are positive rising up the economy of the country. So some serious measures to lower the negative impacts and to maximize the positive impacts should be adopted.


Recommendations

In recent times, it seems that the government has recognized foreign employment opportunities as one way to alleviate poverty and unemployment in the country. So, government should implement different policies and programs for promotion, control and management of foreign employment. Though some policies have been implemented under Foreign Employment Act by Department of Foreign Employment, they are not carried out effectively and efficiently. So, they require more attention from the government of Nepal.


 Government of Nepal should pay attention to areas listed below for promoting, controlling and managing the foreign employment.

v  Foreign employment services and opportunities must be expanded, in order to create a favorable environment for sending the maximum number of Nepalese workers to the maximum number of countries for employment. For this purpose, training programs should provide skills to Nepalese workers according to the demands of foreign employers. The private sector will be taken into consideration as an active partner in the provision of such training programs.

v  Special programs should be conducted to provide security for workers who are willing to go to a foreign country for employment.

v  Training programs should be conducted in rural and urban areas with the participation of local bodies, to increment employment.

v  Foreign employment institutions should be established with the participation of the private sector for the development of foreign employment opportunities.

v  In countries where the greatest possibilities for foreign employment exist, diplomatic missions of Nepal should be mobilized and a labor attaché should be kept in order to protect the rights and security of Nepalese workers.

v  Provisions should be made to protect women and minors from health hazards, abuse, immoral activities and exploitation and no child should be engaged in work in any enterprises.

v  Effective and strong policies should be implemented for the employment agencies called ‘Manpower Company’ that are also responsible for sending people abroad for employment to prevent the illegal migration of people for foreign employment.

v  Subagents or brokers should be completely avoided and transparent selection programs should be developed.

v  Besides these major provisions, government should also conduct consultation meetings with the experts, occupational groups, trade unions and foreign employment enterprises to make rules and regulations for the promotion and management of foreign employment occupation.


Conclusions

Finally the study has concluded that the foreign labor migration can be regulated with the proper implementation of government policies and programs. The foreign employment profession should also be accepted as a dignified occupation as because of its importance to strengthen the national economy and it also making our young people engage in some sorts of income generating activities even in the difficult period of the country.


References

v  Ojha, Purushottam(2010).Foreign Employment and Its Impact on Nepalese Economy[PowerPoint Slides].

v  Jones, H., and Basnett, Y. (June, 2013).Foreign Employment and Inclusive Growth in Nepal.

v  Seddon, D., Gurung, G., and Adhikari, J. (January 1, 1998). Foreign Labor Migration and the Remittance Economy of Nepal. Himalaya, the Journal of the Association for Nepal and Himalayan studies: Vol. 18: No. 2, Article 7.

v  Bhattarai, P. (October, 2005). Migration of Nepalese Youth for Foreign Employment: Problems and Prospects: A Review of Existing Government Policies and Programs.

v  Gurung, G. (2004). An Overview Paper on Overseas Employment in Nepal.

v  Samriddhi, the Prosperity Foundation. (September, 2011). Foreign Employment for Economic Growth.
 

PLOTTER AND DIGITAL PRINTER

Plotter
Simply plotter is a computer printer for printing vector graphics. In the past, plotters were used in applications such as computer-aided design, though they have generally been replaced with wide-format conventional printers. Plotter actually draws point to point lines directly from vector graphic files. Plotter is the first output device that could print graphics as sell as accommodate full size engineering and architectural drawings. A plotter gives a hard copy of the output. It draws pictures on paper using a pen. Plotters are used to print designs of ships and machines, plans for buildings and so on.
Plotters offered the fastest way to efficiently produce very large drawings or color high-resolution vector-based artwork when computer memory was very expensive and processor power was very limited, and other types of printers had limited graphic output capabilities
Pen plotters print by moving a pen or other instrument across the surface of a piece of paper. This means that plotters are vector graphics devices, rather than raster graphics as with other printers. Pen plotters can draw complex line art, including text, but do so slowly because of the mechanical movement of the pens. They are often incapable of efficiently creating a solid region of color, but can hatch an area by drawing a number of close, regular lines.
Pen plotters have essentially become obsolete, and have been replaced by large-format inkjet printers and LED toner based printers. Such devices may still understand vector languages originally designed for plotter use, because in many uses, they offer a more efficient alternative to raster data.
Other types of plotters
• Drum Plotter,
• The Flat bed plotter
• Inkjet Plotter
• Electrostatic printer
The Drum Plotter
In case of the Drum Plotters the pen is motioned on a single axis track while the paper itself moves on a cylindrical drum in a perfect bid to add another axis to the same. So that size of the graph is limited only by the width of the drum and can be of any length.

The Flat bed Plotter
This is yet another output device associated with a plotter for it is one of the three types of a plotter. Now in case of the Flat bed Plotter, the paper is fixed on a flat surface while the pens are motioned to draw the image. This is the plotter type which can successfully use several colored pens for the purpose so that the effect is different from the regular. Here the size of the plot is limited only by the size of the flat bed.

The Inkjet Plotter
This is the third kind of Plotter which is effectively pushes beads of ink directly onto the medium. In Today’s world, virtually all inkjets create color. Low-end inkjets make the most of the three ink colors (cyan, magenta and yellow), but finally create a complex black that is often mud-spattered. Four-color inkjets make use of the black ink created for pure black printing alone.
Electrostatic printer
A plotter that uses an electrostatic method of printing.liquid toner models use of positively charged toner that is attracted to paper which is –vely charged by passing a line of electrodes.Models prints in black and white or colour.Newly electrostatic printer are of large format laser printer and focus light onto a charged drum using laser or led.

Digital printer
It is a device that prints digital image from a computer or digital camera. It is methodsof printing from a digital-based image directly to a variety of media. It usually refers to professional printing where small-run jobs from desktop publishing and other digital sources are printed using large-format and/or high-volume laser or inkjet printers. Digital printing has a higher cost per page than more traditional offset printing methods, but this price is usually offset by avoiding the cost of all the technical steps required to make printing plates. It also allows for on-demand printing, short turnaround time, and even a modification of the image (variable data) used for each impression. The savings in labor and the ever-increasing capability of digital presses means that digital printing is reaching the point where it can match or supersede offset printing technology’s ability to produce larger print runs of several thousand sheets at a low price.
The main difference between digital printing and traditional methods is that ther e is no need to replace printing plates in digital printing, whereas in analog printing the plates are repeatedly replaced. This results in quicker turnaround time and lower cost when using digital printing. The most popular methods include inkjet or laser printers that deposit pigment or toner onto a wide variety of substrates including paper, photo paper, canvas, glass, metal, marble, and other substances.

Cartographic Map for humanitarian purpose

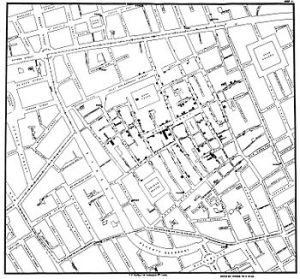
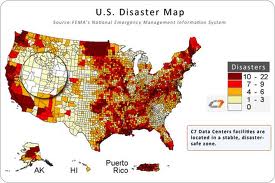
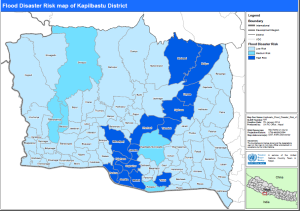
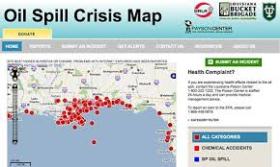
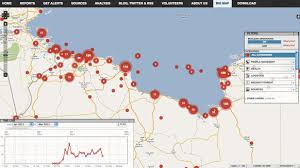
Use of cartographic maps Crisis Map: Crisis mapping is the real-time gathering, display and analysis of data during a crisis, usually a natural disaster or social, political conflict etc. Crisis mapping projects usually allows large numbers of people, including the public and crisis responders, to contribute information either remotely or from the site of the crisis. One benefit of the crisis mapping method over others is that it can increase awareness since the public can report information and improve data management. Crisis mappers work with data that comes from diverse sources and can be produced for varying purposes. crisis map   Hunger Map: Hunger Map is another cartographic map that is used widely in today’s world. Hunger maps are mostly used in order to minimize the malnutrition problem. Hunger maps are often used by UNO in order to analyze the food crisis in various countries. More than that a country can also use this map to find out the food shortage in various places. Hunger map used by WFO in 2011 has shown below.hunger map         Cholera Map: Cholera map was made in order to solve the problem occurred due to cholera in England. This map was first made by John Snow map. The result obtained by this map is that most people infected are of water resources, it is a water borne diseases and spread by contaminated water. This discovery came to influence public health and the construction of improved sanitation facilities beginning in the 19th century. cholera map Disaster Map: Disaster map are the map made in order to analyze the condition of place after disaster. Many disaster map are made at many places .Flood disaster risk map is  made in Kapilvastu .Disaster map also helps for the volunteer to find out the most effected places. And also to find out the risky places.  The disaster map made in US and disaster risk map of Kapilbastu has shown below:Project disasterdisaster risk map

Applicaton of map for Humanitarian Cause

Applicaton of map for Humanitarian  Cause

With the modernization and globalization of world we can visualize world through maps according to our purpose. Maps that are introduced for humanitarian up to this stage are

  • Conflict map

Conflict mapping is a technique that is used to show the relationships of the conflict actors to each other and to the prioritized conflict. Conflict maps clarify where the power lies and where your organization is situated among the conflict parties. These maps are helpful in identifying potential allies and opportunities to intervene. In the course of the 20th century, mankind experienced some of the most devastating wars of all times. Where did these wars take place? Have some regions experienced more wars than others? Who were the main protagonists in these conflicts? This map gives you the opportunity to answer these questions. It displays wars with at least 1 000 military battle deaths.


  • Crisis map

Crisis mapping is a tool in emergencies. Crisis Mapping has emerged in the last five years as a dynamic combination of advanced technology, user-generated mapping, and new methodologies in crisis reporting. Governments, the United Nations, Non-governmental organizations and private sector companies are now beginning to use it in their everyday operations. This has led to a shift in how information on emerging crises is reported, displayed, analyzed and responded to.


The damage caused by the 2010 earthquake in Haiti is well known. Less known is the dynamic crisis mapping effort that emerged alongside disaster relief. To visualise the crisis space, volunteers combined satellite imagery data with real-time crowdsourced crisis information using new media tools. Crisis mapping has since been used in various contexts – showing how non-state actors are using new media to provide and visualise information during crises. State actors should invest in understanding this phenomenon and the circumstances in which crisis maps are valuable contributions to crisis management.

A conflict mapper can use this mapping guide in numerous ways. It can be used by each party on its own, in an effort to clarify the conflict from their own perspective. Or it can be used jointly, in an effort to understand both sides’ view of the conflict. A third party (such as a mediator) could interview the conflict parties with the guide, draft a map, ask the parties to modify it from their perspectives, redraft it, and present it as a first joint step toward cooperative resolution. Alternatively, this could be done by parties on one side who would solicit cooperation from their opponents in creating an accurate conflict map.


  • Disaster map

Disaster mapping is the mapping of areas that have been disturbed through extreme natural or human caused disruptions to the normal environment such that there is a loss of life or value to the area. It is normally possible to delineate the area affected by the disruption.


  • Health map

HealthMap is a freely accessible, automated electronic information system for monitoring, organizing, and visualizing reports of global disease outbreaks according to geography, time, and infectious disease agent. In operation since September 2006, and created by John Brownstein, PhD and Clark Freifeld, MS, HealthMap acquires data from a variety of freely available electronic media sources (e.g. ProMED-mailEurosurveillanceWildlife Disease Information Node) to obtain a comprehensive view of the current global state of infectious diseases. Users of HealthMap come from a variety of organizations including state and local public health agencies, the World Health Organization (WHO), the US Centers for Disease Control and Prevention, and theEuropean Centre for Disease Prevention and Control. HealthMap is used both as an early detection system and supports situational awareness by providing current, highly local information about outbreaks, even from areas relatively invisible to traditional global public health efforts. Currently, HealthMap monitors information sources in English, Chinese, Spanish, Russian, French, Portuguese, and Arabic.

URBANIZATION AND CHALLENGES OF LAND USE IN NEPAL

URBANIZATION AND CHALLENGES OF LAND USE IN NEPAL


INTRODUCTION

Nepal  is  landlocked country  as well as developing country. However developing process is moving on. Nowadays urbanization is increasing. Urbanization is a process of increase of modernization system in which people are living in small areas which depends upon development of industalization ,infrastructure within town, cities and their neighbourhoods. Urban development has enlarged the modification of natural resources and has changed land use and land cover patterns. Various causes of the urbanization process bring the unrestrained impact on land use and land cover change. An unplanned urbanization process is becoming the major problem in the developed and developing countries. Population growth, migration, political instability, economic opportunities, centralized plans and policies of the government, accessibility of physical infrastructure, globalization are some of the major causes of the high level of urbanization in Nepal.

Growth of Urban Population and Urban Places in Nepal   

Table1  provide a list of urban  areas and included the percent of population in  censuses since 1952/54 and the year 2001 accordingly, the number of designated urban areas has gone up from 10 in 1952/54 to 58 in 2001. In the five decades since the 1950s, urban population increased from 0.238 million to 3.23 million while the number of designated urban places increased  from 10 to 58. In the decade of 1952/54, urban population observed 238275, but this number has been increased in 336222 in 1961 and reached 461938 in 1971. Likewise, population trend increased rapidly in 1981, 1991 and 2001 it  observed 956721, 1695719 and 3227879 respectively.  The percent of urban population in the country has grown from 2.9 percent to 13.9 percent. It may be noted that average annual change in the percent of urban population has been steadily increasing since the seventies.

Census year 1952/54 1961 1971 1981 1991 2001
Urban places 10 16 16 23 33 58
Total percentage ofurban population 2.9 3.6 4.0 6.4 9.2 13.9

Table 1 : Total number of urban places and percent of

urban population of Nepal 1952/54 – 2001


Impacts on Land

Nepal is an agricultural country. More than 70 percent of total 27 million people in Nepal are directly or indirectly dependent on land as their basic means of livelihood. However, lack of farm commercialization has limited the contribution of agriculture only  at one-third of the total Gross Domestic Product (GDP) of the country.

The scarce land in Nepal  has been threatened from different phenomenon  such as encroachment of public land, haphazard use of land without scientific use system, increasing fallow land due to lack of farm workers and increasing urbanization in fertile land. On the other hand increasing population, land  slide and  soil erosion  have  posed  a huge challenge to the management of land in the tiny Himalayan nation– Nepal. Land  in the hilly remote areas are increasingly becoming fallow and deserted due to rapid migration to urban areas where land is also under growing pressure of over population which has ultimately led to the encroachment of public land to shrinkage of arable land on the back of increasing urbanization and development of development  infrastructure.

Saying Nepal as agricultural country  but Nepal has to depend upon import of food from neighboring India to fulfill supply deficit amid growing demands for food.

Land fragmentation is another problem in the country. There are about 3.3 parcels in each land holding, and the average size of a parcel was 0.24 ha in 2001. Such a small size of a parcel is also not  conducive when using modern inputs, especially when building infrastructure such as irrigation facilities.

Current status of land use

Only about 21% out of the  total area of the country (not exactly147,181 sq km) is cultivable  in Nepal. Agricultural land (2,498,000 ha in 2001) is distributed across  three different ecological belts.The mountain areas account  for 6.8% of available agricultural land and 7.3% of the total population of Nepal; hills 40% of available land and 44.3% of the population and  the terai 52.9% of the land and 48.4% of the population. The average land holding size is 0.96 ha with 32.1% of households being landless (Central Bureau of Statistics).Out of the total land holdings, 1.4% landowners own 14%of arable land. Of the total cultivable land, about 9% is under the tenancy system.

Major challenges in land management in Nepal

  • Lack of workforce to work in the farm
  • Increasing trend of leaving fallow land amid rising migration to urban areas
  •  Rising outflow of youths to overseas and India for employment
  • Deforestation, soil erosion and landslides
  • Rapid urbanization in cultivable fertile land
  • Increasing encroachment of public land by different individuals and organizations
  • Fragmentation of land with increasing number of households
  • Haphazard of use of land without keeping in view of its impact in environment and food security
  • Concentration of land in limited people
  • Lack of government specific policy and programs to properly use these resources.

CONCLUSION/ RECOMMENDATIONS

Hence urbanization is increasingly rapidly, it is good for Nepal like developing country but it is affecting directly as well as indirectly in the economy of Nepal.There are various challenges to be faced in different sector.Land management and is equally important. Hapazard urbanization negatively affect on agriculture which results on low food production and should depend upon imported food product from other country .So our income goes to other country which directly affects on economic condition .It also creats imbalance in the biological and social environment. Similarly people lacks from employment so both urbanization and land management should proceeded simultaneously.

In my opinion nothing is impossible ,every problems have its solutions. If these solutions are followed then I think their will be little progress in land management.Some of them are:

  • The government should implement the  land use policy by following related laws that support the scientific land management initiations from the government.
  • We should come up with the land use  programs to  utilize the land on the basis of nature of soil, fertility, geographical situation, environment and climate as per the existing act.
  • The government has to discourage human settlement in fertile land and awarness of food scarcity in the country.
  • Making availability of employment  which control  migration.

Climate change and its impacts on economy

Durga Prasad Ojha

Introduction

Climate change refers to alterations in weather patterns or a climate system over a period of time resulting from natural processes or activities by humans and other organisms. Climate change is a significant and lasting change in the statistical distribution of weather pattern. Global warming is currently the greatest trigger of climate change and it results from depletion of the ozone layer by carbon emission. So global warming is currently the greatest environmental concern in the world.
While climate change is a global issue, it will affect us all. Climate change has the potential to adversely affect our environment; our communities and our economy unless we take action now to reduce our greenhouse gas emissions and prepare for the impacts. Climate change will alter global and local climates. Climate change may be limited to a specific region, or may occur across the whole Earth.
The Earth’s climate can be affected by natural factors that are external to the climate system, such as changes in volcanic activity, solar output, and the Earth’s orbit around the Sun. Climate change can also be caused by human activities, such as the burning of fossil fuels and the conversion of land for forestry and agriculture. Since the beginning of the Industrial Revolution, these human influences on the climate system have increased substantially.
The average temperatures in Nepal increased at an annual rate of .06°C between 1977 and 2000, with a 0.04°C increase in the Terai and 0.08°C increase in the Himalayas. Over the period 1948 to 2010, the average annual temperature in Canada has warmed by 1.6 °C, a higher rate of warming than in most other regions of the world.
Impacts of Climate Change

Current climate variability already has significant economic costs due to high climate sensitivity of agricultural sector and frequency of major weather-related disasters such as floods and landslides. Future climate change has the potential to exacerbate these impacts, through increased average temperatures, changes in annual and seasonal rainfall, and changes in variability and climate extremes. These will potentially affect the key sectors in Nepal, including agriculture, health, water availability, energy use, infrastructure, and biodiversity and ecosystem services with the potential to lead to huge economic costs for individual sectors and at the aggregate level (GDP). Climate change therefore has the potential to negatively affect planned development and sector investment plans, threatening country’s sustainable development goals.
Scientists and economists are beginning to grapple with the serious economic and environmental consequences if we fail to reduce global carbon emissions quickly and deeply which causes climate change.
• Damage to property and infrastructure: Water level rises, flood , landslides, wildfires and extreme storms damage the property and infrastructure which require extensive repair of essential infrastructure such as homes, roads, bridges, railroad tracks, airport runways, power lines, dams, levees, and seawalls.
• Lost Productivity: Disruptions in daily life related to climate change can mean harm trade, transportation, fisheries, energy production, and tourism. Severe rainfall events and snowstorms can delay planting and harvesting, cause power outages, snarl traffic, delay air travel, and otherwise make it difficult for people to go about their daily business. Climate-related health risks also reduce productivity.
• Decrease in Production: It also affects in agriculture. Due to climate change the rate of production of several crops like rice, wheat, maize, different types of fruits, vegetables, etc are decreasing order.
• Mass migration and threats: Global warming is likely to increase the number of “climate refugees”—people who are forced to leave their homes because of drought, flooding, or other climate-related disasters. Mass movements of people and social disruption may lead to civil unrest, and some economic problem.
• Insurance industry: Especially government-sponsored insurance will face major challenges. “In an average year, about 90 percent of insured catastrophe losses worldwide are weather-related,” the report says. “Escalating exposures to catastrophic weather events, coupled with private insurers’ withdrawal from various markets, are placing the federal government at increased financial risk as insurer of last resort.”
• Recreation and tourism industries: Recreation and tourism industries are affected by climate change.
• Demand for electricity: Demand for electricity rises to cool homes and offices, and demand for heating (in the form of natural gas and fuel oil) falls. Meanwhile, while electricity demand rises, energy production (in fossil or nuclear power plants, for example) is expected to be constrained by rising temperatures and limited water supplies in many regions. Climate-change-induced water shortages and other disruptions in some regions of the country are likely to constrain energy production.
• Marine life: Global temperatures rising will cause the ice worldwide to melt. This melting will also add large amounts of freshwater to the oceans, which will lower the salinity of the oceans. This water being added to the ocean can also slow down or stops the ocean currents. The salinity change and the change in the currents will kill of much of the marine life in the ocean.
• Real estate price: Real estate prices will rise, due to the simple fact that there will be much less land to buy and sell.

Recommendations

The following important recommendations should get priority in policy:
• Awareness and Training programs about climate change.
• Develop irrigation infrastructure for reducing drought hazards.
• Develop cooperation and coordination with neighboring country to cope with Vulnerabilities.
• Develop climate-forecasting system for reducing hazards.
• Reduce the production of Carbon. We should stop emitting greenhouse gases. To reduce carbon dioxide emissions and avoid dangerous interference with the climate system, we must switch to alternative, carbon-free energy sources.
• Plantation of crops that maximize carbon sequestration. Increasing forestlands and making changes to the way we farm could increase the amount of carbon we’re storing.
• To Control Climate Change, Alternative Energy Technologies Must Be Developed Uncertainty in the climate sensitivity to growing levels of atmospheric carbon dioxide has been a stumbling block to policy makers addressing the climate change issue.

Conclusions

Climate change is real and underway, so there is a need of impact identification and adoption to cope with vulnerabilities. It is moving towards vulnerable situation due to climate change. Its effects cannot be completely controlled but effective planning and change in human habit towards a low carbon economy can slower down possible disasters.

References

• Union of concerned Scientists (2011). Retrieved from http://www.climatehotmap.org/global-warming-effects/economy.html
• Synnott, P. (2012). Climate Change, Agriculture, & Food Security in Nepal: Developing Adaptation Strategies and Cultivating Resilience. [Pdf].
• Kioeppel, J. E. (March 27, 2003). To Control Climate Change, Alternative Energy Technologies Must Be Developed. Retrieved from http://earthobservatory.nasa.gov
• Retrieved From http://en.wikipedia.org/wiki/Economic_impacts_of_climate_change

Harvard Humanitarian initiative on CRISIS MAPPING AND EARLY WARNING

Harvard Humanitarian initiative on CRISIS MAPPING AND EARLY WARNING

Launched in 2007, HHI’s Program on Crisis Mapping and Early Warning examines the use of information communications technologies in conflict and disaster settings. Research focuses on identifying patterns in humanitarian emergencies to improve response. HHI examines the impact of crisis mapping, geospatial and crowd sourcing technologies to prepare, mitigate, and respond to emergencies

BACKGROUND

Mobile information technology devices have come to play an increasingly important role in responding to humanitarian emergencies and providing critical data to improve the understanding of the complex dynamics of emergencies and local and international response. HHI’s Crisis Mapping and Early Warning program seeks to develop an evidence base to evaluate information technologies, to convene the humanitarian and technical communities, to facilitate dialogue among humanitarian actors, and to provide new sources of data to improve understanding of conflict dynamics.

Through its convening role, HHI is creating a community of practice to catalyze discussion among disparate groups of experts in a sustained forum that will refine crisis tools and promote best practices to save lives. The development of a community of practice is essential to help facilitate the integration of social media, crowd sourcing, and new grassroots geospatial tools into the humanitarian cluster system.

Through a variety of ongoing initiatives HHI is working to:

  • Build evaluation tools to assess the impact of information technologies on the internal decision making processes of humanitarian organizations
  • Convene humanitarian actors and members of the voluntary technical community to facilitate dialogue and to develop prototype frameworks for integrating new tools and methods into the humanitarian community
  • Report on the current state of humanitarian information management, mapping the interface between the humanitarian community and an emerging grassroots technology community.

CURRENT PROJECTS

Today, HHI continues to play a pivotal role in defining the future of Crisis Mapping and Early Warning by catalyzing dialogue across several fields of expertise to accelerate learning in humanitarian response, digital technology and computational methods. Below is a listing of our current projects:

DISASTER RELIEF 2.0

This open analysis research project was commissioned by the Office for the Coordination of Humanitarian Affairs (OCHA) and funded by the UN Foundation/Vodafone Foundation Technology Partnership. Through a series of interviews and focus groups, this research captures reflections of members in both the humanitarian community and the voluntary and technical community. The research further provides an opportunity for both communities to come together to enhance future collaborations. The document, released in March 2011, “Disaster Relief 2.0: Recommendations for collaborative information-sharing in humanitarian crises,” shared key lessons learned about how these two communities have worked together in recent humanitarian emergencies and offered recommendations and a potential framework to enhance future collaboration. The full report: Disaster Relief 2.0: The Future of Information Sharing in Humanitarian Emergencies

SATELLITE SENTINEL PROJECT

The Satellite Sentinel Project is a collaborative framework that includes the Harvard Humanitarian Initiative, the United Nations, Digital Globe, the Enough Project, and Not on Our Watchand includes partnerships with private corporations and other academic institutions. A team at HHI and the Carr Center for Human Rights Policy at Harvard’s Kennedy School lead the development and management of the Sentinel system. The project is the first of its kind to fuse together satellite imagery, on-the-ground field reporting, and crisis mapping applications into a unified monitoring platform to detect, deter, and document threats to Sudanese civilians. The project represents a breakthrough in the development of “protective humanitarian” technologies that employ the strategic collection and targeted presentation of data to deter and prevent mass atrocities.

INTERNATIONAL CONFERENCE ON CRISIS MAPPING

The International Conference on Crisis Mapping (ICCM) was launched in partnership with HHI and John Carroll University in 2009. The conference brings together practitioners, scholars, software developers and policymakers at the cutting edge of crisis mapping. The International Network of CrisisMappers (CrisisMappers.net) was launched at the first ICCM and has served as a community and operational facilitator during recent disasters and crises. The network includes some 3,000 individual members and 1,500 organizations based in over 120 countries worldwide.

TECHNOLOGY EVALUATION THROUGH FIELD SIMULATION

The Crisis Dynamics program has integrated information management, mapping and crowd source data reporting into HHI’s Humanitarian Studies Initiative Field Simulation.

MONITORING AND EVALUATION OF TECHNOLOGY IN CRISIS MANAGEMENT

HHI is developing its expertise in monitoring and evaluation and will build on its evaluation of Ushahidi to foster a learning process based on real-life technology implementation. HHI was an early partner of Ushahidi and continues to collaborate with the non-profit organization and other organization that use the Ushahidi platform. Recent projects in Kenya and Colombia focus on further understanding how to improve the user interface of Ushahidi’s crowd sourcing and information management system for decision making.

 Image


Suman Ghimire

Land Use planning In Nepal

Introduction

Land is important property and economic resource for settlement and development activities. The land occupied by a country or state is fixed so a scientific, wise and long term land use planning is required to develop a country. Planning aims beneficial to land users in a sustainable manner and which safeguard land resources and the environment rather than exhausting or degrading them. Cultivation land, forest, pasture, urban settlement, parks and conservation areas has to be managed to keep its productivity at a certain level and its exploration optimally beneficial for both the individual land users and society as a whole. Land is widely used by individual land users who intend to maximize their economic profit and simply disregard environmental or longer-term negative effects. A lack of effective land-use policy and planning mechanisms has affected the overall governance in the country.


Objective of land use planning:

  • To classify the land for the use of cultivation, forestry, grazing, settlement, and other uses.
  • To classify the land to conserve resources like water, forest, bio-diversity, heritages etc.
  • To identify and plan environmentally the transitional major settlements of Nepal.
  • To control and discourage unauthorized land use.
  • To maintain balance between development and environment.
  • To control the fragmentation of land and haphazard urbanization.


Procedures

  • Establishment of coordinating, monitoring and implementing Mechanism
  • Legal Aspect
  • Technical aspects of Land Use Planning


Technical aspects

  • Convert the spatial and attribute data into digital form.
  • Use existing maps and data for accuracy and to revise or update these digital data using remote sensing or digital photogrammetric technique, field surveys and other appropriate methods.
  • To develop capability maps, norms arrange legal bases and prepare land use zoning of the areas for agricultural, forest, grazing, and settlement using GIS tools.
  • To develop macro and district levels Land Use Planning maps and data systematically.
  • To develop the VDC and Municipality level Land Use Plan.


Treatment of maps and data

All maps and data are required to convert in spatial digital form in one projection system and uniform scales. The digital maps and data must be updated or revised by the method of remote sensing or photogrammetry or field survey method as per the changes occurred.  Large scale maps or high resolution GIS is required to prepare the land use plans of an area. Cadastral records like land classification, land use information may be used to relate land use planning information.


Conclusion

Land use plan will have long term impact on environmental, sustainable development and overall economic development. The human resources base should be strengthened through seminars, workshops, interaction programs, media and site visits.


References